
Network World Lab Test: Enterprise Backbone Switch/Routers
Test Methodology, 2004 Edition
v. 2.04 Copyright © 2002-2004 by Network Test Inc. Vendors are encouraged to comment on this document and any other aspect of test methodology. Network Test reserves the right to change the parameters of this test at any time.
By David Newman
This document’s URL is http://networktest.com/gbe04/gbe04meth.html. A Word version of this document is available at ftp://public.networktest.com/pub/gbe04/gbe04meth.zip.
Please forward comments to dnewman at networktest.com
1 Executive summary
This document describes the methodology used in assessing enterprise backbone switch/routers with 10-gigabit Ethernet and gigabit Ethernet interfaces.
Network World has an open invitation to 10G Ethernet switch/router vendors to take part in the tests described here. These are single-product reviews. We will conduct these same tests on each product as it is available.
This document describes how we test the following mandatory events:
- 10G Ethernet baseline performance (IPv4)
- Gigabit Ethernet baseline performance (IPv4)
- Gigabit Ethernet performance over a 10G Ethernet backbone (IPv4)
- Failover and resiliency
- Quality of service (QOS) enforcement
- SSH support
- Features
Vendors also may elect to participate in the following optional events:
- 10G Ethernet baseline performance (IPv6)
- Gigabit Ethernet baseline performance (IPv6)
- Gigabit Ethernet performance over a 10G Ethernet backbone (IPv6)
- Time permitting, other events as desired
This is the 2004 edition of this methodology. We will run these tests on any backbone switch/router tested for the balance of 2004. After that we will revise the methodology on an annual basis. We welcome input on revisions at any time.
This document is organized as follows. This section introduces the test. Section 2 presents guidelines for scoring and other testing ground rules. Section 3 describes requirements for the device under test and test equipment. Section 4 describes test procedures. Section 5 describes the change history of this document.
2 Scoring and testing ground rules
2.1 Test scoring
Reviews published in Network World present test results in three formats: In charts or tabular form; in discussion in the article text; and in a “NetResults” scorecard. This section discusses the weightings used to produce that scorecard.
Scorecards have a maximum rating of 5.0, where 5 = excellent, 4 = very good, 3 = average, 2 = below average, and 1 = consistently subpar.
This methodology has mandatory and optional events. We give 90 percent weighting to the mandatory tests. For example, a device with perfect results in all mandatory events and no optional tests would have a score of 4.5 out of 5.0. That is the maximum possible score by participating only in the mandatory events.
Optional events are additive, in that they only can increase a device’s overall score. We only publish scores for optional tests if we conduct those tests; we do not publish scores of zero if a vendor does not participate in optional tests.
The following table lists the weightings we use to score mandatory and optional test events.
|
MANDATORY EVENTS (TOTAL ADDS TO 100 PERCENT OF
4.5) |
|
|
10G Ethernet Ethernet baseline performance (IPv4) |
15% |
|
Gigabit Ethernet baseline performance (IPv4) |
15% |
|
Gigabit Ethernet performance over a 10G Ethernet backbone (IPv4) |
15% |
|
Failover and resiliency |
15% |
|
Quality of service (QOS) enforcement |
15% |
|
SSH support |
10% |
|
Features |
15% |
|
|
|
|
OPTIONAL EVENTS (TOTAL ADDS TO 100 PERCENT OF
0.5) |
|
|
10G Ethernet Ethernet baseline performance (IPv6) |
33% |
|
Gigabit Ethernet baseline performance (IPv6) |
33% |
|
Gigabit Ethernet performance over a 10G Ethernet backbone (IPv6) |
33% |
|
Time permitting, other events as desired |
0% |
We recognize vendors often desire to showcase a feature that differentiates their device from others. We welcome the opportunity to test such features.
However, this has proven problematic when it comes to scoring. In the past, we have included all results, including those from extra tests, in overall scoring. More than once, results from extra tests have proven less than optimal. Vendors have then complained that our scoring compared apples and oranges – even though that’s exactly what vendors asked us to do in the first place.
The new policy allows extra tests (time permitting) but does not factor results from such tests into the scorecard. We will discuss results from such tests in other parts of the article, including any text and graphics other than the numerical part of the scorecard.
The same policy applies to pricing. For tests of high-end backbone equipment, Network World does not factor price into its scorecard ratings. We may discuss pricing in the article text and/or in the pros-and-cons section of the summary.
2.2 Scoring example
The following table illustrates how we would score a device with perfect 5.0 scores in all events, mandatory and optional. Note that the NetResults scorecard will show only the values in the column labeled “Score” and the totals. We include the other columns here to show how weighting works.
|
MANDATORY
EVENTS (TOTAL ADDS TO 100 PERCENT OF 4.5) |
Score |
Weight |
Weighted
score |
Out of total |
Adjusted
score |
|
10G
Ethernet Ethernet baseline performance (IPv4) |
5.0 |
15% |
0.8 |
4.5 |
0.7 |
|
Gigabit
Ethernet baseline performance (IPv4) |
5.0 |
15% |
0.8 |
4.5 |
0.7 |
|
Gigabit
Ethernet performance over a 10G Ethernet backbone (IPv4) |
5.0 |
15% |
0.8 |
4.5 |
0.7 |
|
Failover
and resiliency |
5.0 |
15% |
0.8 |
4.5 |
0.7 |
|
Quality
of service (QOS) enforcement |
5.0 |
15% |
0.8 |
4.5 |
0.7 |
|
SSH
support |
5.0 |
10% |
0.5 |
4.5 |
0.5 |
|
Features |
5.0 |
15% |
0.8 |
4.5 |
0.7 |
|
Total –
mandatory events |
4.5 |
||||
|
|
|||||
|
OPTIONAL
EVENTS (TOTAL ADDS TO 100 PERCENT OF 0.5) |
|
|
|
|
|
|
10G
Ethernet Ethernet baseline performance (IPv6) |
5.0 |
33% |
1.7 |
0.5 |
0.2 |
|
Gigabit
Ethernet baseline performance (IPv6) |
5.0 |
33% |
1.7 |
0.5 |
0.2 |
|
Gigabit
Ethernet performance over a 10G Ethernet backbone (IPv6) |
5.0 |
33% |
1.7 |
0.5 |
0.2 |
|
Total --
optional events |
0.5 |
||||
As noted, we only publish scores for optional events if we conduct those tests. In cases where we conduct only the mandatory tests (and/or cases that include extra tests not scored), the NetResults scorecard will include only the mandatory events results; we will not print an optional section with all zeroes.
2.3 Unreleased product testing
Vendors may supply unreleased versions of hardware and software for testing, provided the device under test will be available to Network World readers within 60 days of the test’s scheduled publication date.
We make no distinction between released products and alpha-, beta-, or gold-code products. If an unreleased version of a product catches fire (an extreme case, perhaps) or produces otherwise undesirable results (a more common outcome), we will note such results in the review.
We ask vendors to supply hardware and software version information along with all configurations for all tests. This ensures repeatability and helps answers questions as to what we tested.
2.4 No selective publication, no withdrawals
We strongly encourage vendors to prepare for all tests by running them in their labs before coming into ours. We will supply test scripts and consult with vendors on any and all aspects of test methodology. After testing we also share complete results and solicit vendor input on the results. The last thing we want is any result that surprises or embarrasses any vendor.
That said, Network World’s policy is to publish all results from all tests. This may include results a vendor may perceive as negative. Network World will not honor requests to publish only the “good” results from a set of tests.
As noted in section 1, Network World maintains a standing open invitation to run this set of tests. Vendors are welcome to schedule retests to showcase new features or to correct previous problematic results.
3 The test bed
This section discusses requirements of systems under test and introduces the test equipment to be used.
3.1 Devices under test
Participating vendors must supply the following:
- 2 chassis
- at least 4 10-gigabit Ethernet interfaces (10GBase-LR, 1310-nm lasers, single-mode)
- at least 48 gigabit Ethernet interfaces (1000Base-SX, 850-nm lasers, multimode, or copper RJ-45), spread across at least 2 line cards (e.g., at least 1 line card per chassis)
- any required device management software and hardware
We strongly encourage vendors to supply 20 percent additional spare interfaces.
3.2 Test Hardware
3.2.1 Spirent SmartBits
The principal test instrument for this project is the SmartBits traffic generator/analyzer manufactured by Spirent Communications Inc. Spirent’s SmartBits 6000B chassis will be equipped with the company’s XLW-3720A 10-gigabit Ethernet cards and SmartBits LAN-3325 TeraMetrics XD and/or LAN-3311 or LAN-3301 TeraMetrics gigabit Ethernet cards.
The 10-gigabit Ethernet cards use XENPAK MSA modules with 1,310-nm optics.
The 3325 gigabit Ethernet cards use mini-GBICs with LC connectors. The 3311 cards use full-size GBICs with SC connectors. The 3301 cards use copper interfaces with RJ-45 interfaces.
Siemon Co. has furnished multimode cabling with all combinations of LC-LC, SC-SC, and LC-SC connector types.
4 Test procedures
For each routine in this section, this document describes:
· the test objective(s);
- the configuration to be used;
- the procedure to be used;
- the test metrics to be recorded;
- reporting requirements.
4.1 Baseline 10-gigabit performance (IPv4)
4.1.1 Objectives
Determine throughput, delay, jitter, and sequencing for 10 gigabit Ethernet interfaces forwarding unicast IPv4 traffic
4.1.2 Test bed configuration
Figure 1 below shows the physical test bed topology for the 10-gigabit Ethernet baseline tests. This device under test (DUT) is one chassis equipped with four 10-gigabit Ethernet interfaces in one or more line cards. We attached SmartBits 10-Gbit/s Ethernet test interfaces to the DUT.
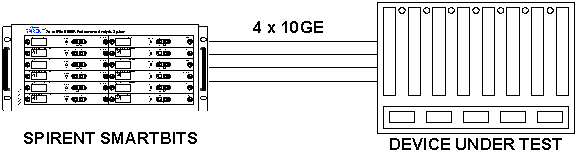
Figure 1: 10-Gbit/s
IPv4 baseline physical topology
Note that we conduct separate tests for performance in a single four-port 10G Ethernet line card, and between two ports on each of two line cards.
Figure 2 below shows the logical test bed topology for the 10-gigabit Ethernet baseline tests. We emulate 8,000 IP hosts on each of four subnets, and offer traffic in a fully meshed pattern among all subnets.
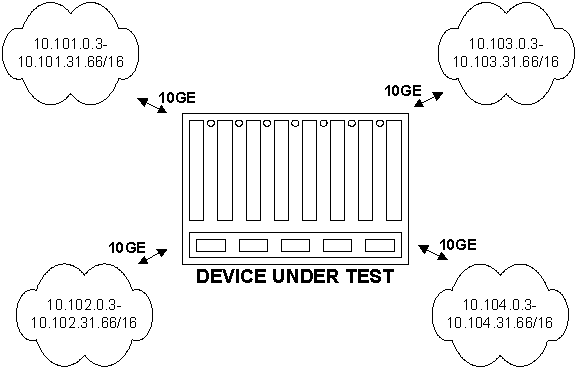
Figure 2: 10-Gbit/s
IPv4 baseline logical topology
The MAC addresses we use
take the form 00:PP:PP:RR:RR:RR, where PP is the test instrument’s port number
(expressed in hexadecimal format) and RR are pseudorandom hexadecimal numbers.
The following table lists
the IP addressing to be used by the DUT and the test instrument. Test traffic
will represent 8,000 unique host IP addresses per subnet. The host IP addresses on each subnet will
begin at IP address 10.x.0.3/16.
|
DUT |
TEST
INSTRUMENT |
||||
|
Chassis number |
Interface type |
Port IP address/ |
Interface type |
Port IP address/ |
Hosts emulated |
|
1 |
10GE |
10.101.0.1/16 |
10GE |
10.101.0.2/16 |
10.101.0.3-10.101.31.66 |
|
1 |
10GE |
10.102.0.1/16 |
10GE |
10.102.0.2/16 |
10.102.0.3-10.102.31.66 |
|
1 |
10GE |
10.103.0.1/16 |
10GE |
10.103.0.2/16 |
10.103.0.3-10.103.31.66 |
|
1 |
10GE |
10.104.0.1/16 |
10GE |
10.104.0.2/16 |
10.104.0.3-10.104.31.66 |
We will use SAI scripts to generate and analyze traffic.
The test traffic shall consist of 64-, 256-, 1,518-byte and 9000-byte jumbo frames carrying UDP/IP headers[1] (offered in separate runs) using a bidirectional traffic orientation and a fully meshed distribution. See RFC 2285 for definitions of traffic orientation and distribution.
Management traffic such as OSPF hellos, discovery protocols, or VRRP messages may interfere with test traffic, and may adversely affect throughput. Vendors should either disable such messages or set timers high enough so that management traffic does not degrade data-plane performance.
Vendors should either disable aging or set timers to high values for ARP and layer-2 forwarding databases.
4.1.3 Procedure
Using a binary search algorithm, we offer traffic to each interface in a fully meshed pattern to determine the throughput rate and frames received in sequence.
At an intended load of 10 percent of line rate, we measure also run tests to determine minimum delay, average delay, maximum delay, delay distribution (histograms), and jitter. Note that this procedure varies from the RFC 2544 recommendation to measure latency at the throughput level. Experience suggests that devices with throughput less than line rate will have difficulty repeating throughput tests without loss across multiple iterations. Latency measurements in the presence of loss are invalid. Since it may not be practical to measure latency at the throughput level, we instead use an offered load of 10 percent of line rate.
We repeat this test with 64-, 256-, 1,518- and 9,000-byte
frames.
We repeat this test with four interfaces on a single line card, and two interfaces on each of two line cards.
Test duration is 60 seconds per iteration.
The precision of delay and jitter measurements is +/- 100 nanoseconds.
4.1.4 Metrics
Throughput (64, 256, 1518, jumbo, single card)
Throughput (64, 256, 1518, jumbo, two cards)
Average delay (64, 256, 1518, jumbo, single card)
Average delay (64, 256, 1518, jumbo, two cards)
Maximum delay (64, 256, 1518, jumbo, single card)
Maximum delay (64, 256, 1518, jumbo, two cards)
Latency distribution (histogram) (64, 256, 1518, jumbo, single card)
Latency distribution (histogram) (64, 256, 1518, jumbo, two cards)
Jitter (64, 256, 1518, jumbo, single card)
Jitter (64, 256, 1518, jumbo, two cards)
Frames received out of sequence (all tests)
4.1.5 Reporting requirements
DUT configuration
DUT hardware and software version
SmartBits configuration
Test results
4.2 Baseline 10-gigabit performance (IPv6) (optional)
4.2.1 Objectives
Determine throughput, delay, jitter, and sequencing for 10 gigabit Ethernet interfaces forwarding unicast IPv6 traffic
4.2.2 Test bed configuration
Figure 3 below shows the physical test bed topology for the 10-gigabit Ethernet baseline tests. This device under test (DUT) is one chassis equipped with four 10-gigabit Ethernet interfaces on one or more line cards. We attached SmartBits 10-Gbit/s Ethernet test interfaces to the DUT.
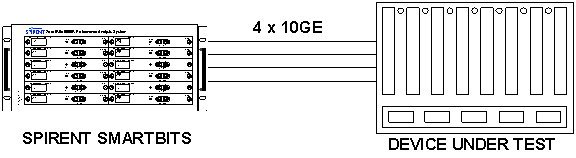
Figure 3: 10-Gbit/s
IPv6 baseline physical topology
Note that we conduct separate tests for performance in a single four-port 10G Ethernet line card, and between two ports on each of two line cards.
Figure 4 below shows the logical test bed topology for the 10-gigabit Ethernet baseline tests. We emulate 8,000 IP hosts on each of four subnets, and offer traffic in a fully meshed pattern among all subnets.
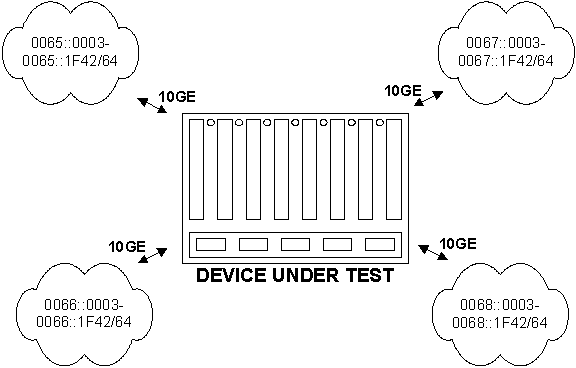
Figure 4: 10-Gbit/s
IPv6 baseline logical topology
The MAC addresses we use
take the form 00:PP:PP:RR:RR:RR, where PP is the test instrument’s port number
(expressed in hexadecimal format) and RR are pseudorandom hexadecimal numbers.
The following table lists
the IP addressing to be used by the DUT and the test instrument. Test traffic will
represent 8,000 unique host IP addresses per subnet. The host IP addresses on each subnet will begin at IP address
006x::0003/64.
|
DUT |
TEST
INSTRUMENT |
||||
|
Chassis number |
Interface type |
Port IP address/ |
Interface type |
Port IP address/ |
Hosts emulated |
|
1 |
10GE |
0065::0001/64 |
10GE |
0065::0002/64 |
0065::0003-0065::1F42/64 |
|
1 |
10GE |
0066::0001/64 |
10GE |
0066::0002/64 |
0066::0003-0066::1F42/64 |
|
1 |
10GE |
0067::0001/64 |
10GE |
0067::0002/64 |
0067::0003-0067::1F42/64 |
|
1 |
10GE |
0068::0001/64 |
10GE |
0068::0002/64 |
0068::0003-0068::1F42/64 |
We will use SAI scripts to generate and analyze traffic.
The test traffic shall consist of 84[2]-, 256-, 1,518-byte and 9,000-byte jumbo frames carrying UDP/IP headers[3] (offered in separate runs) using a bidirectional traffic orientation and a fully meshed distribution. See RFC 2285 for definitions of traffic orientation and distribution.
Management traffic such as OSPF hellos, discovery protocols, or VRRP messages may interfere with test traffic, and may adversely affect throughput. Vendors should either disable such messages or set timers high enough so that management traffic does not degrade data-plane performance.
Vendors should either disable aging or set timers to high values for neighbor discovery and layer-2 forwarding databases.
4.2.3 Procedure
Using a binary search algorithm, we offer traffic to each interface in a fully meshed pattern to determine the throughput rate and frames received in sequence.
At an intended load of 10 percent of line rate, we measure also run tests to determine minimum delay, average delay, maximum delay, delay distribution (histograms), and jitter. Note that this procedure varies from the RFC 2544 recommendation to measure latency at the throughput level. Experience suggests that devices with throughput less than line rate will have difficulty repeating throughput tests without loss across multiple iterations. Latency measurements in the presence of loss are invalid. Since it may not be practical to measure latency at the throughput level, we instead use an offered load of 10 percent of line rate.
We repeat this test with 84-, 256-, 1,518- and 9,000-byte
frames.
Test duration is 60 seconds per iteration.
We repeat this test with four interfaces on a single line card, and two interfaces on each of two line cards.
The precision of delay and jitter measurements is +/- 100 nanoseconds.
4.2.4 Metrics
Throughput (84, 256, 1518, jumbo, single card)
Throughput (84, 256, 1518, jumbo, two cards)
Average delay (84, 256, 1518, jumbo, single card)
Average delay (84, 256, 1518, jumbo, two cards)
Maximum delay (84, 256, 1518, jumbo, single card)
Maximum delay (84, 256, 1518, jumbo, two cards)
Latency distribution (histogram) (84, 256, 1518, jumbo, single card)
Latency distribution (histogram) (84, 256, 1518, jumbo, two cards)
Jitter (84, 256, 1518, jumbo, single card)
Jitter (84, 256, 1518, jumbo, two cards)
Frames received out of sequence (all tests)
4.2.5 Reporting requirements
DUT configuration
DUT hardware and software version
SmartBits configuration
Test results
4.3 Baseline gigabit Ethernet performance (IPv4)
4.3.1 Objective
Determine throughput, delay, jitter, and sequencing for gigabit Ethernet interfaces forwarding unicast IPv4 traffic
4.3.2 Test bed configuration
The DUT for this event is one gigabit Ethernet line card. We attach SmartBits 1-Gbit/s Ethernet test interfaces to all interfaces the DUT.
We recognize that port counts will differ among DUTs. For example, one vendor may supply a DUT with 24 gigabit Ethernet interfaces, while another may have a 48-port card.
Since there is no standard number of interfaces per line card, we conduct this test on all data-plane interfaces for a given card. While it does not and cannot prevent apples-and-oranges comparisons, it does describe the performance limits of each DUT when fully loaded.
The MAC addresses we use
take the form 00:PP:PP:RR:RR:RR, where PP is the test instrument’s port number
(expressed in hexadecimal format) and RR are pseudorandom hexadecimal numbers.
The following table lists
the IP addressing to be used by the DUT and the test instrument. In this table,
“N” represents the number of data-plane interfaces in the line card. Test
traffic will represent 64 unique host IP addresses per subnet. The host IP addresses on each subnet will
begin at IP address 10.x.0.3/16.
|
DUT |
TEST
INSTRUMENT |
||||
|
Chassis number |
Interface type |
Port IP address/ |
Interface type |
Port IP address/ |
Hosts emulated |
|
1 |
GE |
10.1.0.1/16 |
GE |
10.1.0.2/16 |
10.1.0.3-10.1.0.66 |
|
1 |
GE |
10.2.0.1/16 |
GE |
10.2.0.2/16 |
10.2.0.3-10.2.0.66 |
|
1 |
GE |
10.3.0.1/16 |
GE |
10.3.0.2/16 |
10.3.0.3-10.3.0.66 |
|
1 |
GE |
… |
GE |
… |
… |
|
1 |
GE |
10.N.0.1/16 |
GE |
10.N.0.2/16 |
10.N.0.3-10.N.0.66 |
We will use SAI scripts to generate and analyze traffic.
The test traffic shall consist of 64-, 256-, 1,518-byte and 9000-byte jumbo frames carrying UDP/IP headers (offered in separate runs) using a bidirectional traffic orientation and a fully meshed distribution. See RFC 2285 for definitions of traffic orientation and distribution.
Management traffic such as OSPF hellos, discovery protocols, or VRRP messages may interfere with test traffic, and may adversely affect throughput. Vendors should either disable such messages or set timers high enough so that management traffic does not degrade data-plane performance.
Vendors should either disable aging or set timers to high values for ARP and layer-2 forwarding databases.
4.3.3 Procedure
Using a binary search algorithm, we offer traffic to each interface in a fully meshed pattern to determine the throughput rate and frames received in sequence.
At an intended load of 10 percent of line rate, we measure also run tests to determine minimum delay, average delay, maximum delay, delay distribution (histograms), and jitter. Note that this procedure varies from the RFC 2544 recommendation to measure latency at the throughput level. Experience suggests that devices with throughput less than line rate will have difficulty repeating throughput tests without loss across multiple iterations. Latency measurements in the presence of loss are invalid. Since it may not be practical to measure latency at the throughput level, we instead use an offered load of 10 percent of line rate.
We repeat this test with 64-, 256-, 1,518- and 9,000-byte
frames.
Test duration is 60 seconds per iteration.
The precision of delay and jitter measurements is +/- 100 nanoseconds.
4.3.4 Metrics
Throughput (64, 256, 1518, jumbo)
Average delay (64, 256, 1518, jumbo)
Maximum delay (64, 256, 1518, jumbo)
Latency distribution (histogram) (64, 256, 1518, jumbo)
Jitter (64, 256, 1518, jumbo)
Frames received out of sequence (all tests)
4.3.5 Reporting requirements
DUT configuration
DUT hardware and software version
SmartBits configuration
Test results
4.4 Baseline gigabit Ethernet performance (IPv6) (optional)
4.4.1 Objective
Determine throughput, delay, jitter, and sequencing for gigabit Ethernet interfaces forwarding unicast IPv6 traffic
4.4.2 Test bed configuration
The DUT for this event is one gigabit Ethernet line card. We attach SmartBits 1-Gbit/s Ethernet test interfaces to all interfaces the DUT.
We recognize that port counts will differ among DUTs. For example, one vendor may supply a DUT with 24 gigabit Ethernet interfaces, while another may have a 48-port card.
Since there is no standard number of interfaces per line card, we conduct this test on all data-plane interfaces for a given card. While it does not and cannot prevent apples-and-oranges comparisons, it does describe the performance limits of each DUT when fully loaded.
The MAC addresses we use
take the form 00:PP:PP:RR:RR:RR, where PP is the test instrument’s port number
(expressed in hexadecimal format) and RR are pseudorandom hexadecimal numbers.
The following table lists
the IP addressing to be used by the DUT and the test instrument. In this table,
“N” represents the number of data-plane interfaces in the line card. Test
traffic will represent 64 unique host IP addresses per subnet. The host IP addresses on each subnet will
begin at IP address 10x::3/64.
|
DUT |
TEST
INSTRUMENT |
||||
|
Chassis number |
Interface type |
Port IP address/ |
Interface type |
Port IP address/ |
Hosts emulated |
|
1 |
GE |
0001::0001/64 |
GE |
0001::0002/64 |
0001::0003-0001::0042 |
|
1 |
GE |
0002::0001/64 |
GE |
0002::0002/64 |
0002::0003-0002::0042 |
|
1 |
GE |
0003::0001/64 |
GE |
0003::0002/64 |
0003::0003-0003::0042 |
|
1 |
GE |
… |
GE |
… |
… |
|
1 |
GE |
000N::0001/64 |
GE |
000N::0002/64 |
000N::0003-000N::0042 |
We will use SAI scripts to generate and analyze traffic.
The test traffic shall consist of 64-, 256-, 1,518-byte and 9000-byte jumbo frames carrying UDP/IP headers (offered in separate runs) using a bidirectional traffic orientation and a fully meshed distribution. See RFC 2285 for definitions of traffic orientation and distribution.
Management traffic such as OSPF hellos, discovery protocols, or VRRP messages may interfere with test traffic, and may adversely affect throughput. Vendors should either disable such messages or set timers high enough so that management traffic does not degrade data-plane performance.
Vendors should either disable aging or set timers to high values for neighbor discovery and layer-2 forwarding databases.
4.4.3 Procedure
Using a binary search algorithm, we offer traffic to each interface in a fully meshed pattern to determine the throughput rate and frames received in sequence.
At an intended load of 10 percent of line rate, we measure also run tests to determine minimum delay, average delay, maximum delay, delay distribution (histograms), and jitter. Note that this procedure varies from the RFC 2544 recommendation to measure latency at the throughput level. Experience suggests that devices with throughput less than line rate will have difficulty repeating throughput tests without loss across multiple iterations. Latency measurements in the presence of loss are invalid. Since it may not be practical to measure latency at the throughput level, we instead use an offered load of 10 percent of line rate.
We repeat this test with 84-, 256-, 1,518- and 9,000-byte
frames.
Test duration is 60 seconds per iteration.
The precision of delay and jitter measurements is +/- 100 nanoseconds.
4.4.4 Metrics
Throughput (84, 256, 1518, jumbo)
Average delay (84, 256, 1518, jumbo)
Maximum delay (84, 256, 1518, jumbo)
Latency distribution (histogram) (84, 256, 1518, jumbo)
Jitter (84, 256, 1518, jumbo)
Frames received out of sequence (all tests)
4.4.5 Reporting requirements
DUT configuration
DUT hardware and software version
SmartBits configuration
Test results
4.5 Gigabit Ethernet performance over a 10G Ethernet backbone (IPv4)
4.5.1 Objectives
Determine throughput, delay, and jitter of IPv4 traffic from 1-Gbit/s interfaces aggregated onto a 10-Gbit/s backbone
4.5.2 Test bed configuration
Figure 5 below shows the physical test bed topology for the bandwidth aggregation tests. The system under test (SUT) comprises two chassis, each configured with 10 gigabit Ethernet interfaces and 1 10-gigabit Ethernet interface.
We do not oversubscribe the 10G Ethernet backbone in this test.
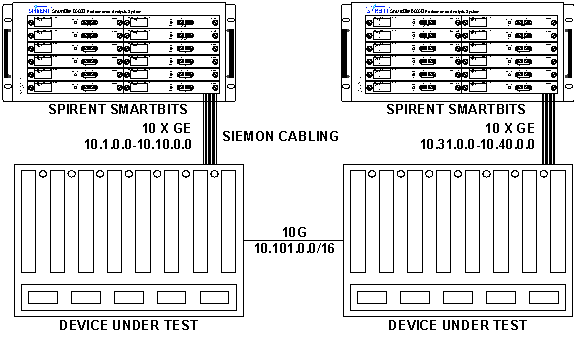
Figure 5: IPv4
Backbone Physical Topology
We attach SmartBits 1-Gbit/s Ethernet test interfaces to the DUT.
The MAC addresses we use
take the form 00:PP:PP:RR:RR:RR, where PP is the test instrument’s port number
(expressed in hexadecimal format) and RR are pseudorandom hexadecimal numbers.
The following table lists
the IP addressing to be used by the DUT and the test instrument. Test traffic
will represent 512 unique host IP addresses per subnet. The host IP addresses on each subnet will
begin at IP address 10.x.0.3/16. With
512 hosts per interface and 20 edge interfaces (10 on each chassis), this
represents 20,240 unique host addresses on the test bed.
DUT |
TEST
INSTRUMENT |
||||
|
Chassis number |
Interface type |
Interface IP address/ |
Interface type |
Interface IP address/ |
Hosts emulated |
|
1 |
GE |
10.1.0.1/16 |
GE |
10.1.0.2/16 |
10.1.0.3-10.1.2.6 |
|
1 |
GE |
10.2.0.1/16 |
GE |
10.2.0.2/16 |
10.2.0.3-10.2.2.6 |
|
1 |
GE |
10.3.0.1/16 |
GE |
10.3.0.2/16 |
10.3.0.3-10.3.2.6 |
|
1 |
GE |
… |
GE |
… |
… |
|
1 |
GE |
10.10.0.1/16 |
GE |
10.10.0.2/16 |
10.10.0.3-10.10.2.6 |
|
1 |
10GE |
10.101.0.1/16 |
NA |
NA |
NA |
|
2 |
10GE |
10.101.0.254/16 |
NA |
NA |
NA |
|
2 |
GE |
10.31.0.1/16 |
GE |
10.31.0.2/16 |
10.31.0.3-10.31.2.6 |
|
2 |
GE |
10.32.0.1/16 |
GE |
10.32.0.2/16 |
10.32.0.3-10.32.2.6 |
|
2 |
GE |
10.33.0.1/16 |
GE |
10.33.0.2/16 |
10.33.0.3-10.33.2.6 |
|
2 |
GE |
… |
GE |
… |
… |
|
2 |
GE |
10.40.0.1/16 |
GE |
10.40.0.2/16 |
10.40.0.3-10.30.2.6 |
We will use custom-developed Spirent SAI scripts to generate and analyze traffic. Our test pattern can also be generated using Spirent’s SmartFlow application.
The test traffic shall consist of 64-, 256-, 1,518-, and 9,000-byte jumbo frames carrying UDP/IP headers (offered in separate runs) using a bidirectional traffic orientation and a fully meshed distribution. See RFC 2285 for definitions of traffic orientation and distribution.
Management traffic such as OSPF hellos, discovery protocols, or VRRP messages may interfere with test traffic, and may adversely affect throughput. Vendors should either disable such messages or set timers high enough so that management traffic does not degrade data-plane performance.
Vendors should either disable aging or set timers to high values for ARP and layer-2 forwarding databases.
4.5.3 Procedure
Using a binary search algorithm, we offer traffic to each interface in a fully meshed pattern to determine the throughput rate and frames received in sequence.
At an intended load of 10 percent of line rate, we measure also run tests to determine minimum delay, average delay, maximum delay, delay distribution (histograms), and jitter. Note that this procedure varies from the RFC 2544 recommendation to measure latency at the throughput level. Experience suggests that devices with throughput less than line rate will have difficulty repeating throughput tests without loss across multiple iterations. Latency measurements in the presence of loss are invalid. Since it may not be practical to measure latency at the throughput level, we instead use an offered load of 10 percent of line rate.
We repeat this test with 64-, 256-, 1,518- and 9,000-byte
frames.
Test duration is 60 seconds per iteration.
The precision of delay and jitter measurements is +/- 100 nanoseconds.
4.5.4 Metrics
Throughput (64, 256, 1518, jumbo)
Average delay (64, 256, 1518, jumbo)
Maximum delay (64, 256, 1518, jumbo)
Latency distribution (histogram) (64, 256, 1518, jumbo)
Jitter (64, 256, 1518, jumbo)
Frames received out of sequence (all tests)
4.5.5 Reporting requirements
DUT configuration
DUT hardware and software version
SmartBits configuration
Test results
4.6 Gigabit Ethernet performance over a 10G Ethernet backbone (IPv6) (optional)
4.6.1 Objectives
Determine throughput, delay, and jitter of IPv6 traffic from 1-Gbit/s interfaces aggregated onto a 10-Gbit/s backbone
4.6.2 Test bed configuration
Figure 6 below shows the physical test bed topology for the bandwidth aggregation tests. The system under test (SUT) comprises two chassis, each configured with 10 gigabit Ethernet interfaces and 1 10-gigabit Ethernet interface.
We do not oversubscribe the 10G Ethernet backbone in this test.
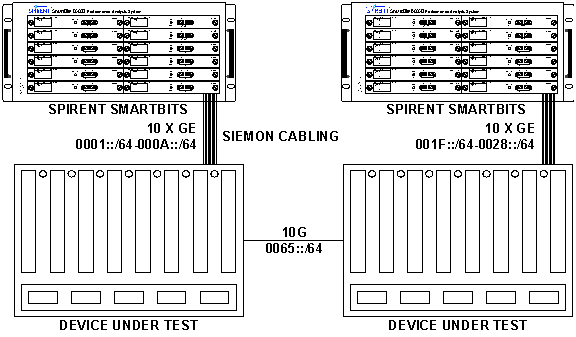
Figure 6: IPv6
Backbone Physical Topology
We attach SmartBits 1-Gbit/s Ethernet test interfaces to the DUT.
The MAC addresses we use
take the form 00:PP:PP:RR:RR:RR, where PP is the test instrument’s port number
(expressed in hexadecimal format) and RR are pseudorandom hexadecimal numbers.
The following table lists
the IP addressing to be used by the DUT and the test instrument. Test traffic
will represent 512 unique host IP addresses per subnet. The host IP addresses on each subnet will
begin at IP address 00xx::0003/64. With 512 hosts per interface and 20 edge
interfaces (10 on each chassis), this represents 20,240 unique host addresses
on the test bed.
|
DUT |
TEST INSTRUMENT |
||||
|
Chassis
number |
Interface
type |
Interface IP
address/ prefix
length |
Interface
type |
Interface IP
address/ prefix
length |
Hosts
emulated |
|
1 |
GE |
101::1/64 |
GE |
101::2/64 |
0001::0003-0001::0202 |
|
1 |
GE |
102::1/64 |
GE |
102::2/64 |
0002::0003-0002::0202 |
|
1 |
GE |
103::1/64 |
GE |
103::2/64 |
0003::0003-0003::0202 |
|
1 |
GE |
… |
GE |
… |
… |
|
1 |
GE |
000A::0001/64 |
GE |
000A::0002/64 |
000A::0003-000A::0202 |
|
1 |
10GE |
0065::0001/64 |
NA |
NA |
NA |
|
2 |
10GE |
0065::00FE/64 |
NA |
NA |
NA |
|
2 |
GE |
001F::0001/64 |
GE |
001F::0002/64 |
001F::0003-001F::0202 |
|
2 |
GE |
0020::0001/64 |
GE |
0020::0002/64 |
0020::0003-0020::0202 |
|
2 |
GE |
0021::0001/64 |
GE |
0021::0002/64 |
0021::0003-0021::0202 |
|
2 |
GE |
… |
GE |
… |
… |
|
2 |
GE |
0028::0001/64 |
GE |
0028::0002/64 |
0028::0003-0028::0202 |
We will use custom-developed Spirent SAI scripts to generate and analyze traffic. Our test pattern can also be generated using Spirent’s SmartFlow application.
The test traffic shall consist of 84-, 256-, 1,518-, and 9,000-byte jumbo frames carrying UDP/IP headers (offered in separate runs) using a bidirectional traffic orientation and a fully meshed distribution. See RFC 2285 for definitions of traffic orientation and distribution.
Management traffic such as OSPF hellos, discovery protocols, or VRRP messages may interfere with test traffic, and may adversely affect throughput. Vendors should either disable such messages or set timers high enough so that management traffic does not degrade data-plane performance.
Vendors should either disable aging or set timers to high values for neighbor discovery and layer-2 forwarding databases.
4.6.3 Procedure
Using a binary search algorithm, we offer traffic to each interface in a fully meshed pattern to determine the throughput rate and frames received in sequence.
At an intended load of 10 percent of line rate, we measure also run tests to determine minimum delay, average delay, maximum delay, delay distribution (histograms), and jitter. Note that this procedure varies from the RFC 2544 recommendation to measure latency at the throughput level. Experience suggests that devices with throughput less than line rate will have difficulty repeating throughput tests without loss across multiple iterations. Latency measurements in the presence of loss are invalid. Since it may not be practical to measure latency at the throughput level, we instead use an offered load of 10 percent of line rate.
We repeat this test with 84-, 256-, 1,518- and 9,000-byte
frames.
Test duration is 60 seconds per iteration.
The precision of delay and jitter measurements is +/- 100 nanoseconds.
4.6.4 Metrics
Throughput (84, 256, 1518, jumbo)
Average delay (84, 256, 1518, jumbo)
Maximum delay (84, 256, 1518, jumbo)
Latency distribution (histogram) (84, 256, 1518, jumbo)
Jitter (84, 256, 1518, jumbo)
Frames received out of sequence (all tests)
4.6.5 Reporting requirements
DUT configuration
DUT hardware and software version
SmartBits configuration
Test results
4.7 Failover and resiliency
4.7.1 Objective
To determine the time needed to reroute IPv4 traffic onto a secondary link upon the failure of a primary link
4.7.2 Test bed configuration
Two chassis with one primary link (10GE) and secondary link (also 10GE) configured between chassis, and at least 1 gigabit Ethernet interface per chassis.
We test failover twice, using two different methods to connect the chassis:
- OSPF equal cost multipath (ECMP)
- IEEE 802.3ad link aggregation
We use Spirent TeraRouting (TRT) to generate and analyze traffic for this test.
All interfaces on the test bed are in OSPF area 0.
Vendors must clear OSPF databases between iterations.
The MAC addresses we use
take the form 00:PP:PP:RR:RR:RR, where PP is the test instrument’s port number
(expressed in hexadecimal format) and RR are pseudorandom hexadecimal numbers.
The following table lists the IPv4 addresses we use in this test.
|
DUT |
TEST
INSTRUMENT |
|||
|
Chassis number |
Interface type |
Interface IP address/ |
Interface type |
Interface IP address/ |
|
1 |
GE |
10.1.0.1/16 |
GE |
10.1.0.2/16 |
|
1 |
10GE |
10.101.0.1/16 |
NA |
NA |
|
2 |
10GE |
10.101.0.254/16[4] |
NA |
NA |
|
2 |
GE |
10.31.0.1/16 |
GE |
10.31.0.2/16 |
4.7.3 Procedure
1. We connect the SmartBits to one gigabit Ethernet interface each on chassis 1 and chassis 2. We configure TRT to set the SmartBits interface on chassis 1 to “transmit only” and the SmartBits interface on chassis 2 to “advertise only.”
2. Both interfaces bring up OSPF adjacencies with the DUT. The SmartBits interface connected to chassis 2 advertises one next-hop route as a type 3 link state advertisement (LSA).
3. After verifying that the route has been propagated, the SmartBits interface connected to chassis 1 offers 64-byte frames at a rate of 1,000,000 fps for 60 seconds.
4. Approximately 10 seconds into the test, we physically remove the primary backbone link. We note the time for traffic to be rerouted over the secondary link.
5. We repeat steps 1-4 with 2,000 and 200,000 routes advertised by TRT. All routes are type 3 LSAs. Because of ECMP load-sharing, traffic initially will move over both the primary and secondary links. The number of flows failed over in this step will be 1,000 and 100,000.
6. We repeat steps 1-5 with IEEE 802.3ad link aggregation instead of OSPF ECMP as the connectivity method between chassis. As in steps 1-5, we use OSPF to route traffic between the test instrument’s transmitting and receiving interfaces.
The test duration is 60 seconds.
4.7.4 Metrics
Failover time with OSPF ECMP (determined from frame loss) (1, 1,000, and 100,000 routes)
Failover time with IEEE 802.3ad link aggregation (determined from frame loss) (1, 1,000, and 100,000 routes)
4.7.5 Reporting requirements
DUT configuration
DUT hardware and software version
SmartBits configuration
Test results
4.8 Quality-of-service enforcement
4.8.1 Objectives
Case 1: Determine whether devices under test allocate fixed bandwidth allocations to given traffic classes during periods of congestion
Case 2: Determine whether devices under test allocate any available bandwidth to a given traffic class during periods of congestion
4.8.2 Test bed configuration
Figure 7 below shows the physical test bed topology for the bandwidth aggregation tests. The system under test (SUT) comprises two chassis, each configured with 24 gigabit Ethernet interfaces and 1 10-gigabit Ethernet interface. This configuration presents the device under test with 24:10 oversubscription.
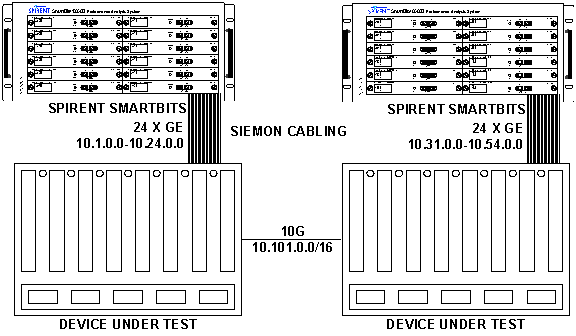
Figure 7: QOS Test
Bed Physical Topology
The MAC addresses we use
take the form 00:PP:PP:RR:RR:RR, where PP is the test instrument’s port number
(expressed in hexadecimal format) and RR are pseudorandom hexadecimal numbers.
The following table lists
the IP addressing to be used by the DUT and the test instrument. Test traffic
will represent 252 unique host IP addresses per subnet. The host IP addresses on each subnet will
begin at IP address 10.x.0.3/16.
|
DUT |
TEST INSTRUMENT |
||||
|
Chassis
number |
Interface
type |
Port
IP address/ prefix
length |
Interface
type |
Port
IP address/ prefix
length |
Hosts
emulated |
|
1 |
GE |
10.1.0.1/16 |
GE |
10.1.0.2/16 |
10.1.0.3-10.1.0.254 |
|
1 |
GE |
10.2.0.1/16 |
GE |
10.2.0.2/16 |
10.2.0.3-10.2.0.254 |
|
1 |
GE |
10.3.0.1/16 |
GE |
10.3.0.2/16 |
10.3.0.3-10.3.0.254 |
|
1 |
GE |
… |
GE |
… |
… |
|
1 |
GE |
10.24.0.1/16 |
GE |
10.24.0.2/16 |
10.24.0.3-10.24.0.254 |
|
1 |
10GE |
10.101.0.1/16 |
NA |
NA |
NA |
|
2 |
10GE |
10.101.0.254/16 |
NA |
NA |
NA |
|
2 |
GE |
10.31.0.1/16 |
GE |
10.31.0.2/16 |
10.31.0.3-10.31.0.254 |
|
2 |
GE |
10.32.0.1/16 |
GE |
10.32.0.2/16 |
10.32.0.3-10.32.0.254 |
|
2 |
GE |
10.33.0.1/16 |
GE |
10.33.0.2/16 |
10.33.0.3-10.33.0.254 |
|
2 |
GE |
… |
GE |
… |
… |
|
2 |
GE |
10.54.0.1/16 |
GE |
10.54.0.2/16 |
10.54.0.3-10.54.0.254 |
We use custom-developed Spirent SAI scripts to generate and analyze traffic. Note that for the QOS test, test traffic cannot be generated using Spirent’s SmartFlow application.
The test traffic shall consist of 128-byte Ethernet frames carrying TCP/IP headers using a bidirectional traffic orientation and a partially meshed multiple device distribution. See RFCs 2285 and RFC 2889 for descriptions of traffic orientation and distribution.
Management traffic such as OSPF hellos, discovery protocols, or VRRP messages may interfere with test traffic, and may adversely affect throughput. Vendors should either disable such messages or set timers high enough so that management traffic does not degrade data-plane performance.
Vendors should either disable aging or set timers to high values for ARP and layer-2 forwarding databases.
The test traffic shall be divided into three classes, distinguished by different diff-serv code points (DSCPs) and TCP port numbers:
|
Priority |
Traffic
type |
|
Destination
TCP port |
|
High |
DLSw |
0x30 (0011 0000) |
2065 |
|
Medium |
Web |
0x20 (0010 0000) |
80 |
|
Low |
FTP |
0x0A (0000 1010) |
20 |
The test instrument will offer all packets with a diff-serv codepoint (DSCP) value set to 0x00. The DUT must re-mark DSCPs as needed. We will spot-check the ability of the DUT to remark DSCPs.
The devices under test must reclassify traffic using DSCP value 0x30 for high priority traffic, 0x20 for medium-priority traffic, and 0x10 for low-priority traffic.
To create congestion, the aggregate offered load of all classes of test traffic will exceed the capacity of the backbone link (or aggregated link) by a ratio of 24:10.
For all tests, we offer traffic to the DUT in a ratio of 1:7:4 for the high, medium, and low traffic classes, respectively.
Devices under test must be configured to enforce the following rules:
- High-priority
traffic (DSCP 110xxx) must be delivered with zero loss.
- Low-priority traffic must not consume more than 2 Gbit/s of bandwidth.
- When high-priority traffic is not present, medium-priority traffic shall be able to use the additional bandwidth made available by the lack of high-priority traffic.
- Vendors must not change device configuration between test cases 1 and 2.
4.8.3 Procedure
Case 1: Offer all three classes of traffic to 12 interfaces on chassis A in a high/medium/low ratio of 1:7:4, at a rate to oversubscribe channel capacity by a factor of 12:10. Observe output rates on destination interfaces.
The traffic classes should be distributed as follows:
|
Case 1 |
INGRESS |
EGRESS |
||
|
Traffic class |
Aggregate offered load (pps) |
Aggregate offered load (bit/s) |
Expected aggregate forwarding rate (pps) |
Expected aggregate forwarding rate (bit/s) |
|
High |
844,594.59 |
864,864,865 |
844,594.59 |
864,864,865 |
|
Medium |
5,912,162.16 |
6,054,054,054 |
5,912,162.16 |
6,054,054,054 |
|
Low |
3,378,378.38 |
3,459,459,459 |
1,689,189.19 |
1,729,729,730 |
|
Total |
10,135,135.14 |
10,378,378,378 |
8,445,945.95 |
8,648,648,649 |
Case 2: Offer medium- and low-priority classes of traffic to 12 interfaces on chassis A in a medium/low ratio of 9:3, at a rate to oversubscribe channel capacity by a factor of 12:10. Observe output rates on destination interfaces.
The traffic classes should be distributed as follows:
|
Case 2 |
INGRESS |
EGRESS |
||
|
Traffic class |
Aggregate offered load (pps) |
Aggregate offered load (bit/s) |
Expected aggregate forwarding rate (pps) |
Expected aggregate forwarding rate (bit/s) |
|
High |
N/A |
N/A |
N/A |
N/A |
|
Medium |
7,601,351.35 |
7,783,783,784 |
6,756,756.76 |
6,918,918,919 |
|
Low |
2,533,783.78 |
2,594,594,595 |
1,689,189.19 |
1,729,729,730 |
|
Total |
10,135,135.14 |
10,378,378,378 |
8,445,945.95 |
8,648,648,649 |
4.8.4 Metrics
Case 1: Forwarding rate of high-, medium-, and low-priority traffic
Case 2: Forwarding rate of medium- and low-priority traffic
4.8.5 Reporting requirements
DUT configuration
DUT hardware and software version
SmartBits configuration
Test results
4.9 SSH Support
4.9.1 Objective
To determine the level of secure shell (SSH) server support in the DUT.
4.9.2 Test bed configuration
Vendors should enable SSH support on the DUT. Vendors should use the default settings for SSH; for example, if the DUT supports network access via SSHv1 and SSHv2 by default, this is how the DUT should be configured.
The test instrument in this event is a host running OpenSSH v. 3.6.1p1 or later, or Van Dyke Software’s SecureCRT v. 4.00 or later.
This test explicitly examines remote access to the DUT over a network; access via a directly attached serial console is out of scope.
4.9.3 Procedure
1. Using a host running SSH client software, we attempt to connect to the DUT over a network using SSH’s version and verbose flags. The IP addressing used is unimportant for purposes of this test.
2. To determine SSHv1 support, we issue this command:
ssh –1 –v –v -v <DUT
address>
3. To determine SSHv2 support, we issue this command:
ssh –2 –v –v -v <DUT
address>
In both cases, we save the output of the session for analysis.
4. We also check whether the DUT’s default configuration supports three other insecure remote access methods: Telnet (port 23), Web (port 80), and SNMPv1/v2C writes (typically port 161).
4.9.4 Metrics
SSH implementation and version number
SSH protocol version(s) supported
Unlike other tests, this is a simple pass/fail event.
To obtain a passing grade, a DUT must:
a. support SSHv2 by default
b. not support SSHv1 by default
c. use an SSH implementation with no known vulnerabilities at test time
d. not support remote access via telnet or Web or SNMPv1 or SNMPv2C by default
Inability to meet any of these criteria will result in a failing grade.
To determine known vulnerabilities, we compare test results against advisories from public security databases including the following:
4.10 Features
4.10.1 Objective
To determine the feature set supported by the DUT
4.10.2 Test bed configuration
Not applicable
4.10.3 Procedure
We ask participating vendors to complete a features questionnaire listing various attributes supported by the DUT. Examples of such attributes include the number and type of physical interfaces; routing protocols; and management methods.
The questionnaire includes a space for vendors to describe features not covered by the various questions.
Network World will publish the results of the features questionnaire, usually in its online edition. The publication should include a caveat that responses are supplied by vendors, and not all features have been verified by Network World.
4.10.4 Metrics
Features supported
4.10.5 Reporting requirements
Features questionnaire
5 Change history
Version 2.04
18 March 2004
Sections 4.1-4.8: Corrected figure numbers
Sections 4.1-4.8: Added pseudorandom notation for MAC addresses
Section 4.2.4: Corrected metrics for minimum-length frames (now 84, was 64)
Section 4.5: Corrected minimum-length frames (now 64, was 84)
Section 4.6.4: Corrected metrics for minimum length frames (now 84, was 64)
Version 2.03
11 March 2004
Section 4: Acknowledged use of Siemon cabling in test bed schematic diagrams
Section 4.1: Extended end of IPv4 address range to make 8,000 emulated hosts (was 7,998)
Sections 4.2, 4.4, and 4.6: Corrected IPv6 addressing and addressing notation
Version 2.02
5 March 2004
Section 4.7.3 step 5. Added number of flows involved in TRT failover tests. Added notation that test instrument uses OSPF even during link aggregation failover.
Version 2.01
3 March 2004
Section 2.1, specified that optional scoring is given only if optional tests are conducted (no zero scores)
Section 2.2, added scoring example
Version 2.00
2 March 2004
Title bar changed to “2004 edition”
section 1: Added mandatory events on gigabit Ethernet baseline performance, SSH support, and features
Added optional IPv6 events: 10G Ethernet baseline performance, Gigabit Ethernet performance over a 10G Ethernet backbone
Added section 2 on scoring and ground rules
section 3.1: Increased minimum 1G Ethernet port density from 24 to 48
section 3.2.2: Deleted AX-4000 reference
section 4: added reporting requirements for each event
section 4.1.2: added language to distinguish same-card and cross-backplane tests
section 4.1.2: added jumbo frames
section 4.1.2: increased virtual host count from 510 to 8,000
section 4.2.2: added language to distinguish same-card and cross-backplane tests
added section 4.2 on 10G Ethernet baseline for IPv6 traffic
section 4.2.2: added jumbo frames
section 4.2.2: increased virtual host count from 510 to 8,000
added section 4.3 on baseline gigabit Ethernet performance (IPv4)
added section 4.4 on baseline gigabit Ethernet performance (IPv6)
section 4.5.2: increased virtual host count from 510 to 8,000
section 4.5.2: added jumbo frames
added section 4.6 on backbone baseline for IPv6 traffic
section 4.6.2: increased virtual host count from 510 to 8,000
section 4.6.2: added jumbo frames
section 4.7: changed traffic generator from SmartWindow to TRT
section 4.7.2: specified failover with OSPF ECMP and 802.3ad only
section 4.7.2: added addressing table
section 4.7.3: modified failover procedure to cover 1, 1,000, and 100,000 routes
section 4.8: cut “Trouble with Trunking” reference from test description
section 4.8.2: Increased 1G Ethernet port density from 24 to 48
section 4.8.2: Added 0x10 DSCP re-marking requirement for low-priority traffic
added section 4.9 on SSH support
added section 4.10 on features
Version 1.51
10 January 2003
Title bar: Changed scheduled publication date to February 2003
Version 1.5
29 October 2002
QOS enforcement: Corrected egress frame and bit rates for cases 1 and 2
Version 1.4
14 October 2002
Product requirements: Dropped requirement for multiple gigabit Ethernet line cards per chassis
Test hardware: Deleted reference to SmartFlow; specified that all tests except failover will use SAI scripts
10GE baseline test: Deleted reference to SmartFlow; added reference to SAI scripts
Bandwidth aggregation: Dropped requirement for multiple gigabit Ethernet line cards per chassis
Version 1.3
3 September 2002
Test hardware: Changed to 3311 cards for gigabit Ethernet
Test hardware: Added description of AX-4000
10GE baseline test: Deleted reference to SmartFlow version number (will use engineering build of forthcoming SmartFlow 2.0 for 10GE tests)
10GE baseline test and bandwitdth aggregation tests: Revised number of emulated hosts to 510
Version 1.2
29 August 2002
Changed “latency” to “delay” throughout to avoid conflict with RFC 1242 definition
Changed “delay variation” to “jitter” throughout, following terms defined in dsterm Internet-Draft
Bandwidth aggregation and QOS tests: Changed “fully meshed” to “partially meshed multiple device” to conform with RFCs 2285, 2889
10GE baseline test: Revised number of emulated hosts back to 4,095
Bandwidth aggregation test: Revised emulated host IP addresses to start on .3
QOS test: Minor wording changes in procedure section
Version 1.1
26 August 2002
Test procedures into: Revised testing time to 2 days
10GE baseline test: Revised number of emulated hosts to 510
Version 1.0
23 August 2002
Initial public release
