
Network World Clear Choice Test: WAN Acceleration
Published
in Network World, 13 August 2007
Test Methodology
Version 2007081301. Copyright
2006-2007 by Network Test Inc. Vendors are encouraged to comment on this
document and any other aspect of test methodology. Network Test reserves the
right to change test parameters at any time.
A PDF version of this document is available here: http://networktest.com/wa07/wa07meth.pdf
1
Executive Summary
This document describes benchmarking procedures for WAN
acceleration devices. Test results are tentatively scheduled for publication in
Network World in August 2007.
Given that Network World’s readership is comprised largely
of corporate network managers, a key focus of these tests will be suitability
of WAN acceleration devices for use in enterprise settings. These tests will
assess devices using the following metrics:
- Functionality
(20% of total scoring)
- Manageability
(20%)
- Performance
(45%)
- Usability
(15%)
This document is organized as follows. This section
introduces the tests to be conducted. Section 2 describes the test bed. Section
3 describes the tests to be performed. Section 4 provides a change log.
2
The Test Bed
2.1
The Logical Test Bed
To assess the effectiveness of WAN acceleration in an
enterprise context, we have constructed a test bed that carries enterprise
traffic and simulates many aspects of enterprise WAN behavior.
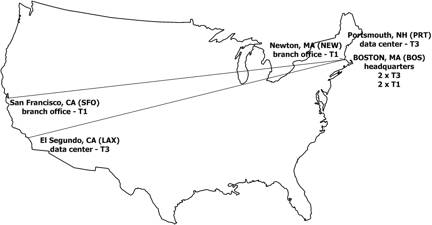
The figure below illustrates the logical test bed. Bogus Corp. has a hub-and-spoke network
connecting its Boston headquarters with data centers in Portsmouth, NH and El
Segundo, CA, and branch offices in Newton, MA and San Francisco, CA.
This network covers all four permutations of low and high
bandwidth and latency. Dedicated T3 (45-Mbit/s) circuits connect the Boston
headquarters with the Portsmouth and El Segundo data centers.[1]
The links between the Boston headquarters and the Newton and San Francisco
branch offices use a VDSL service rate-controlled at 1.5 Mbit/s.
Application traffic between all offices consists of:
CIFS
MAPI (Exchange servers and Outlook clients)
HTTP
SIP/RTP (for QoS tests)
UDP/IP background traffic (for QoS tests)
HTTPS (optional, see “Optional SSL Handling” below)
2.2
The Physical Test Bed
This section discusses the devices to be used on the test
bed.
2.2.1
Device under test/System under test
Each participating vendor is required to supply the
following:
- “Headquarters”
WAN acceleration device(s) capable of supporting two connections at T3 (45-Mbit/s)
rates and two connections at T1 (1.5-Mbit/s) rates. All interfaces should
be copper Ethernet
- Two
“data center” WAN acceleration devices each capable of supporting one
connection at T3 (45-Mbit/s) rates; all interfaces should be copper
Ethernet
- Two
“branch office” WAN acceleration devices each capable of supporting one
connection at T1 (1.5-Mbit/s) rates; all interfaces should be copper
Ethernet
- A
management system capable of remote configuration and monitoring of all WAN
acceleration devices from the headquarters office. Unless you don’t care
whether we run your management software on a 1989 Compaq 386/25, the
management platform should include both hardware and software.
- All
relevant documentation for the WAN acceleration and management systems
2.2.2
Network Impairment
WAN links introduce reduced bandwidth and delay. Our test
bed recreates these conditions using the Spirent
Converged Network Impairment Emulator (SCNIE) between all locations. In addition to standard impairment
functions, SCNIE is the first emulator to implement the TIA-921 standard for
measured impairments over time. The TIA-921 impairment model is based on actual
network conditions measured by service providers.
The following table describes the bandwidth and delay
characteristics of each link.
|
From BOS to… |
Bandwidth |
Round-trip delay (0.5n
applied equally in each direction) |
FIFO buffer size
(bytes)[2]
|
|
POR |
45 Mbit/s |
15 ms |
1,400,000 |
|
NEW |
1.5 Mbit/s |
15 ms |
48,000 |
|
LAX |
45 Mbit/s |
100 ms |
1,400,000 |
|
SFO |
1.5 Mbit/s |
100 ms |
48,000 |
Note that we introduce bandwidth and delay restrictions
only, not packet loss and/or jitter. While these latter two conditions exist on
many WAN circuits, developing a meaningful multi-variable model that factors
for these conditions would greatly increase the number of test permutations. We
hope to model all these factors in future tests, but for now bandwidth and
delay will be the factors used in WAN emulation.
2.2.3
Traffic Generators
We use real Windows servers and clients to offer CIFS, MAPI,
and HTTP traffic. The standard server platform is Windows Advanced Server 2003
R2 running IIS6 and Exchange Server 2003. The standard client platform is
Windows XP Professional SP2 and Office 2007.
To automate the execution of data transfers, we use Visual
Basic scripts custom-developed for this project. Each client runs Microsoft
.Net 2.0 and Office 2007 Primary Interop Assemblies (PIA) to support the
scripts.
To test TCP connection scalability and generate HTTPS
traffic, we plan to use the Spirent
Avalanche and Reflector traffic generator/analyzers. Our Avalanche and
Reflector appliances can generate up to 4 million concurrent TCP connections. Please
advise if your system has a higher rated capacity.
To assess audio quality for VoIP traffic in the QoS tests,
we use the GL
Communications Voice Quality Testing (VQT) tool suite.
To generate background traffic in the QoS tests, we use the
Spirent SmartBits traffic generator/analyzer and Spirent’s SmartWindow
application.
2.2.4
Optional SSL Handling
A growing number of WAN acceleration devices support
optimization of SSL traffic. We plan to conduct performance tests with HTTPS
traffic on those devices that support SSL. Not all devices yet support SSL
optimization. In the interest of ensuring apples-to-apples comparisons, the
main test article will discuss only
those features supported by all products. We plan to discuss SSL results
in a sidebar article accompanying the main test.
2.2.5
IPv4 Addressing
Vendors MAY, at their option, configure their devices to
serve as routers at each location. If not, we will provide line-rate devices to
route traffic between sites.
Some WAN acceleration devices function as proxies and
require IP addresses; others are passive and do not. In either cases, each
device also requires an IP address for device management. We provide addressing
guidelines in the following table. Please let us know if your device does
not meet these addressing requirements.
|
Site |
Inline interface (if
needed) |
Management address |
Management console |
Default gateway |
|
Headquarters (BOS) |
10.0.0.2/24 |
10.0.0.3/24 |
10.0.0.10/24 |
10.0.0.1/24 |
|
Data center (PRT) |
10.1.0.2/24 |
10.1.0.3/24 |
10.0.0.10/24 |
10.1.0.1/24 |
|
Branch office (NEW) |
10.2.0.2/24 |
10.2.0.3/24 |
10.0.0.10/24 |
10.2.0.1/24 |
|
Data center (LAX) |
10.3.0.2/24 |
10.3.0.3/24 |
10.0.0.10/24 |
10.3.0.1/24 |
|
Branch office (SFO) |
10.4.0.2/24 |
10.4.0.3/24 |
10.0.0.10/24 |
10.4.0.1/24 |
3
Test procedures
This section describes procedures used to assess devices in
terms of functionality, manageability, performance, and usability.
3.1
Functionality
Given that not all WAN acceleration devices work the same
way, our assessment of WAN acceleration functionality will attempt to provide a
taxonomy of device features. The questions we plan to answer in assessing
functionality include the following:
- Does
the DUT sit inline or out of the traffic path?
- Does
the DUT compress traffic in flight?
- What
layer-7 traffic types can the DUT identify?
- What
QoS methods does the DUT support for traffic classification and
prioritization?
- Can
the DUT automatically learn and classify different application types?
- Can
the DUT automatically learn and classify application types that
dynamically negotiate port numbers, such as H.323 and SIP? If so, how does
any compression performed by the device affect this ability to detect
application-layer headers?
- What
authentication and encryption methods, if any, does the DUT use to prevent
man-in-the-middle attacks and/or alteration of data in flight?
- Does
the device accelerate UDP as well as TCP traffic?
- Does
the device accelerate SSL traffic? (See “Optional SSL Handling” above;
this will be covered in a sidebar article.)
- Does
the device support incremental updates, where only changes to a large file
or directory structure are transferred? (This is verified in performance
testing as well)
- Does
the device support redundant connections between sites? If so, are the
connections active-active or active-passive? Can the device dynamically
allocate traffic onto one link or another depending on link utilization?
- What
features does the device offer for scalability, both on a per-device basis
and across multiple devices?
- What
other high-availability features, if any, does the device offer?
3.2
Manageability
While increased performance is the nominal reason for
deploying WAN acceleration devices, the addition of any new platform to the
network inevitably raises questions about manageability. While network management
is a huge topic, we plan to focus on configuration and monitoring tasks
specific to WAN acceleration. Among the management criteria to be evaluated:
- What
are the supported device management methods (CLI via ssh, CLI via telnet,
Web UI, proprietary UI)?
- What
are the supported centralized management methods (element manager,
integration into SNMP-based NMS, integration into OSS)?
- How
well does the product support centralized configuration management?
- How
well does the product support centralized management of multiple devices?
- How
well does the management platform support aggregated logging and reporting
from multiple remote acceleration devices?
- Can a
single policy configuration change be applied to multiple devices in one
operation?
- What
traffic reporting tools does the management system offer?
- Does
the management system support partitioned and delegated management, where
different classes of managers have different privilege levels?
- Does
the management system provide “if-then” capability, where it can
dynamically configure devices to assign higher or lower priority to a
given traffic class in response to some administrative or network event
(i.e., prioritize a given video stream during a companywide address by the
CEO)?
3.3
Performance
While functionality, manageability, and usability are all
important criteria in selecting a WAN acceleration device, improving
performance is the key attraction. We
assess device performance in several ways, measuring latency and bandwidth
reduction, QoS handling, and concurrent connection scalability.
Traffic types are:
CIFS (File transfers and directory listings)
MAPI (Outlook and Exchange)
HTTP (Home pages of amazon.com, boston.com, caltech.edu,
cnn.com, and news.bbc.co.uk)
SIP/RTP voice over IP traffic (used only in QoS tests)
UDP/IP background traffic (used only in QoS tests)
HTTPS (optional, if supported)
3.3.1
Delay and bandwidth reduction
For each of the traffic types above except VoIP, we will
measure the effective reduction in delay and bandwidth.
All tests run concurrently between the Boston headquarters
and the four branch sites.
3.3.1.1
CIFS-Pull and CIFS-Push
The CIFS tests involve the transfer of 750 Word 2003 (not
Word 2007) files per each of two clients at each T3 site and 25 Word 2003 files
per each of two clients at each T1 site. The Word files range in size from
roughly 25 kbytes to 1 Mbyte. The file contents are “words” comprising random
characters, with a random word length averaging approximately five characters.
Clients concurrently run a “CIFS-Pull” and “CIFS-Push” test
in which they download and upload files, respectively, from a server in Boston.
In the CIFS-Pull case, clients perform the following
operations:
- Map a
drive to a server directory
- Delete
all files from a local “PullTest” directory
- Delete
the local “PullTest” directory
- Create
a new local “PullTest” directory
- Copy
Word files from the mapped server drive to the new PullTest directory (750
files for clients on T3 links, 25 files for clients on T1 links)
In the CIFS-Push case, clients perform the following
operations:
- Map a
drive to a server directory (this is a different drive letter than in the
CIFS-Pull case)
- Delete
all files from a given server directory
- Delete
the server directory
- Create
a new directory on the server
- Copy
Word files to the new server directory (750 files for clients on T3 links,
25 files for clients on T1 links)
We run the CIFS tests a total of four times:
1. Baseline test with no acceleration enabled and no DUT
inline
2. Acceleration enabled, a “cold” run to allow the DUT to
learn the traffic pattern and possibly cache data
3. Acceleration enabled, a “warm” run after the DUT has
learned the traffic pattern and cached data
4. A “10 percent” run in which 10 percent of the files to be
transferred have been changed
3.3.1.2
MAPI
In the MAPI tests, Outlook 2007 clients on T3 links create
240 messages of random length and with a random number of Word 2003 file
attachments; for clients on T1 links, each creates 10 messages. All messages
are destined to all other clients at all sites.
At test startup, all Outlook clients are in offline mode. A
Visual Basic script running on each client causes it to go online, sending all
messages to the Exchange server in Boston and then on to their destinations.
3.3.1.3
HTTP
In the HTTP tests, Spirent Reflector emulates Web servers
and Spirent Avalanche emulates Internet Explorer Web clients. In all tests,
clients retrieve an 11-kbyte object from one of eight Web servers configured at
the headquarters site.
We conduct the test twice: once with 248 total users and
again with 2,480 total users. The following table lists the distribution of
users:
|
Test |
LAX clients |
NEW clients |
PRT clients |
SFO clients |
|
248 total users |
120 users |
4 users |
120 users |
4 users |
|
2,480 total users |
1,200 users |
40 users |
1,200 users |
4 users |
3.3.1.4
HTTPS
The HTTP tests are identical to the HTTP tests except that
clients retrieve objects over SSL connections.
Not all devices under test support SSL proxying. Thus,
results from this test will appear in a sidebar and will not be used in scoring
results.
3.3.2
QoS Handling
In this test we deliberately oversubscribe a link with
low-priority UDP/IP traffic while simultaneously attempting to place
high-priority VoIP calls. Vendors should not use static bandwidth allocation (aka strict priority) to reserve
bandwidth for VoIP traffic; the final step of our procedure is a check against
TDM-like approaches.
The background traffic consists of UDP/IP packets with a
destination port of 111, generated by Spirent’s SmartBits traffic
generator/analyzer. Note that the packets do not have an NFS header; they are
simply correctly formed UDP/IP packets.
Devices should use
diff-serv code points for prioritization (if supported). Further, devices should
re-mark all incoming packets with new
DSCPs; for this test, assume that the DSCP markings applied by hosts cannot be
trusted.
In this test, the WAN acceleration device should re-mark
VoIP packets with a DSCP value of 40. The device should re-mark UDP/IP
background packets with a DSCP value of 20. We will verify these settings using
a protocol analyzer to capture and decode traffic.
This test uses the following procedure:
- Disable
QoS features on the DUTs. Offer high-bandwidth UDP/IP at a rate of 200
Mbit/s and low-bandwidth VoIP traffic (SIP signaling and RTP media
traffic). Measure forwarding rates and latency for both UDP/IP and VoIP.
- Enable
QoS features on the DUTs. Offer high-bandwidth UDP/IP and low-bandwidth
VoIP traffic (SIP signaling and RTP media traffic). Measure forwarding
rates and latency for both UDP/IP and VoIP.
- Repeat
the previous step using only UDP/IP traffic. This is a check against
TDM-like bandwidth reservation for VoIP traffic.
- Repeat
the three previous steps for all four links (BOS-PRT, BOS-NEW, BOS-LAX,
BOS-SFO).
3.3.3
Concurrent Connection Scalability
This test will determine the maximum number of TCP
connections one pair of WAN acceleration devices can handle.
We using the Spirent Avalanche and Reflector test
instruments to generate traffic and follow this procedure:
1. Using HTTP 1.1, each client emulated by Avalanche
requests a 1-kbyte object from an IIS Web server emulated by Reflector.
2. After receiving the object, the client waits 60 seconds
before requesting the next object. This large client-side latency allows the
buildup of a large number of concurrent connections between clients and
servers.
3. Using the procedure described in the previous step, we
ramp up the number of connections made to the servers. Our two pairs of
Avalanches and Reflectors can request up to 4 million concurrent connections.
The Avalanche load specification for this test is
“connections.” This load profile uses a fairly coarse-grained stair-step
pattern, setting up as many as 4 million connection attempts. We attempt to
measure to the nearest 1,000 concurrent connections.
The following table lists sample load profile phases for a
test with 4 million concurrent connections. Note that the actual counts we use
depend on the DUT’s capability.
|
|
Phase 0 |
Phase 1 |
Phase 2 |
Phase 3 |
|
Label |
Delay |
Stair Step |
Steady State |
Ramp Down |
|
Pattern |
Flat |
Stair |
Stair |
Flat |
|
Time Scale |
Default |
Default |
Default |
Default |
|
Repetitions |
NA |
10 |
1 |
NA |
|
Height |
0 |
400,000 |
0 |
0 |
|
Ramp Time |
0 |
300 |
0 |
0 |
|
Steady Time |
8 |
28 |
64 |
16 |
The metric for this test is maximum concurrent TCP
connection capacity, sustained over a 60-second steady-state period.
3.4
Usability
While usability assessments are inherently subjective, we
also make an effort to make quantitative as well as qualitative judgments about
each DUT’s ease of deployment and maintenance. Among the usability criteria we
plan to use:
- High-quality
documentation in both quick-start and reference areas
- Appliance-style
installation for devices, requiring little more than power-on and address
assignment to bring up the system
- Autolearning
of various application-layer traffic types during initial setup phase
- Multiple
language support in device and element management UIs
- Easy
classification and prioritization of different traffic types
- Intuitive
and useful displays of enterprise-wide tasks, such as a global change in
QoS or security settings
- Intuitive
and useful displays of system status, including real-time and
non-real-time reporting on traffic and acceleration status
Above and beyond these criteria are intrinsically subjective
criteria. If it takes us nine steps on each of five menus to perform a task
that should be available on one screen, we’ll say so. At the same time, we
bring no preconceived notions of “good” or “bad” UI designs to this project. In
the subjective ratings, like all other tests, the ultimate goal is describing how
well the DUT helps the network manager accelerate traffic across the WAN.
4
Change history
Version 2007081301
Test published; changed title to include publication date
Version 2007070301
Section 2.1: Added UDP/IP as background traffic
Section 2.2.2: Deleted jitter from description, noted that
WAN impairment tool introduces rate control and delay only
Added FIFO queue values
Section 2.2.3: Deleted LoadSim reference; added reference to
Outlook client; deleted Asterisk reference; added references to VB scripts,
Office 2007, .Net 2.0, and Office 2007 PIA; added SmartBits reference
Section 2.2.4: Noted that SSL testing will be conducted on
all products but not counted in scoring
Section 2.2.5: Changed IPv4 addressing from /24 to /16 at
each site
Section 3.3: Added UDP/IP as background traffic
Section 3.3.1: Added detailed descriptions of CIFS-Pull,
CIFS-Push, MAPI, HTTP, and HTTPS tests
Section 3.3.2: Changed background traffic from HTTP to
UDP/IP from SmartBits
Section 3.3.3: Restated objective as test between single
pair of devices; deleted concurrent connection testing between all sites
Version 2007010201
Initial public release
Version 20061222
Prerelease copy